Showing posts with label trading plan. Show all posts
Showing posts with label trading plan. Show all posts
Sunday, April 12, 2020
Saturday, April 15, 2017
Saturday, December 31, 2016
Monday, January 4, 2016
Seasonal Entries
Platinum LONG in January
Silver LONG February
Crude Oil / Natural Gas LONG in March
Soybeans LONG in April or June
Natural Gas LONG in September
S&P 500:
long from double bottom at last sept.to october low and flat at the beginning of mai. short only if uptrendline is broken on weekly charts
for 2015 the forecasted uptrends where profitable:
Beginning of January
Beginning of March (LONG)
End of July or August (SHORT)
Beginning of October (LONG)
Mid of December (LONG)
In general the first day of a month are a bullish day.
10 Year Notes Turning Points:
Beginning of January
Beginning of March
Beginning of May
Beginning of December
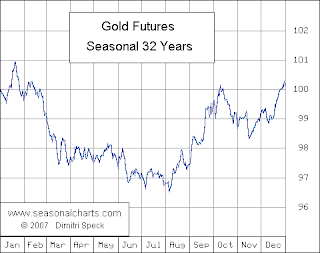
Gold:
Beginning & Mid January
End of July
Mid October
Natural Gas:
Beginning of February
Mid June / July
End of October
Beginning of December
Crude Oil:
End of February
Beginning of May
End of June
Beginning of October
Euro:
(Short) Beginning of the Year
Beginning of February
End of April
Beginning of June
Beginning of September
Beginning of December
Thursday, December 17, 2015
Weekly Trade Setup: Buy last weeks fridays closing price or fridays low and hold the position till the end of the week or prior weeks high
Ideally the market goes to fridays closing price or fridays low and then trades to prior weeks high or even higher.
So either exit the long position at prior weeks high or simply hold the position till friday (or sell half at prior weeks high):
Wednesday, March 13, 2013
Trading Plan: Buying on bullish markets
If a market is in an uptrend (daily above 50 SMA) its profitable to buy on prior days low price and holding the position till the end of the week, as well as buying at any day above the high of the prior two days.
Thursday, January 31, 2013
Tuesday, January 1, 2013
Saturday, November 3, 2012
Trading Plan: 50 day moving average as guideline and entry on prior weeks 50%
Besides looking at the COT data and the trendspotter on barchart.com
I usually enter swing trades if the price is above or below 50 day moving average after a trendlinebreak
To reduce the risk on the entry (prior week closed above / below 50 day moving average) I try to enter at 50% of the prior weeks range:
Performance from july 2007 to november 2012:
I usually enter swing trades if the price is above or below 50 day moving average after a trendlinebreak
To reduce the risk on the entry (prior week closed above / below 50 day moving average) I try to enter at 50% of the prior weeks range:
Performance from july 2007 to november 2012:
Saturday, June 2, 2012
Subscribe to:
Posts (Atom)


+_+FGBL+06-13+(Weekly)++20_04_2012+-+15_03_2013.jpg)
+_+CL+03-13+(Weekly)++12_19_2012+-+2_1_2013.jpg)
+_+ES+03-13+(Weekly)++12_18_2012+-+2_1_2013.jpg)


++Week+10_2012+-+Week+46_2012.jpg)


+_+FGBL+12-12+(Weekly)++4_25_2012+-+10_19_2012.jpg)
+_+CL+12-12+(Weekly)++7_25_2011+-+1_30_2012.jpg)
+_+ZB+12-12+(Weekly)++8_4_2011+-+2_6_2012.jpg)